The Munsell System provides a notation for any color in the universe. The charts contain a careful selection of colors arranged in orderly sequences of HUE, VALUE, and CHROMA.
They are of great importance to those persons who are teaching colors, those who are studying color, and those who are working with color. They form the basis for fundamental exercises in color. A systematic study of these charts will clarify any person’s conception of color and will lead to clear thinking on all problems dealing with this subject.
The color charts also furnish a simple method for estimating the HUE, VALUE, and CHROMA of any color and recording it for future reference. In using these charts for the analysis of colors the most consistent results will be obtained if the following procedure is adhered to:
I. Position of the Chart.
The chart should be viewed squarely; that is, the line of vision should be as nearly as possible from a point squarely out from the surface of the chart. It is best to place the chart on a horizontal surface and view it directly from above.
II. Illumination.
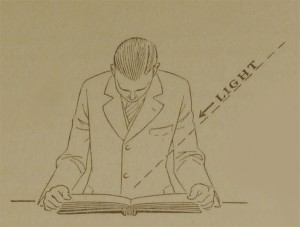
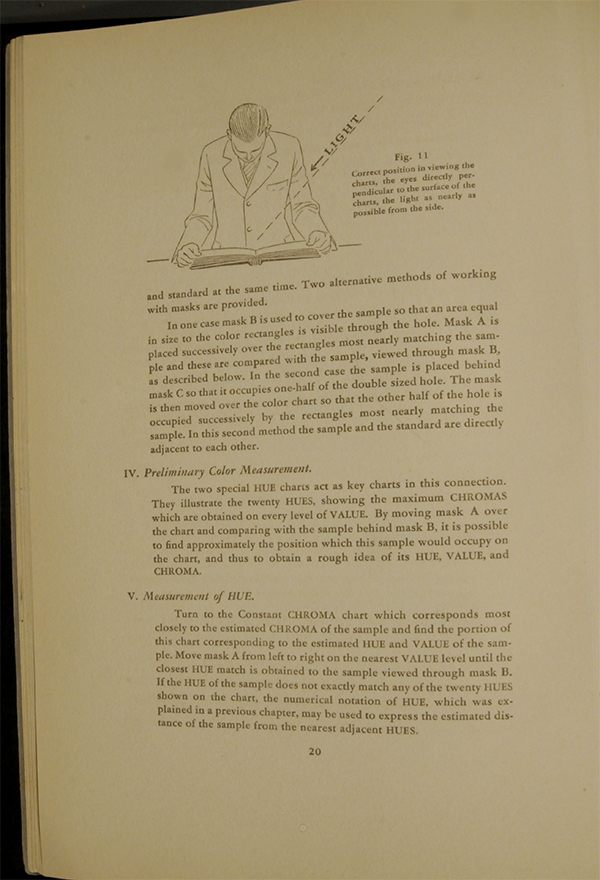
For ordinary purposes the light from any window should be satisfactory, provided only that direct sunlight is avoided. Where greater accuracy is desired a standard artificial daylight lamp is recommended. In all cases, wherever possible, the illumination should fall on the chart at an angle of 45 degrees from the side of the reader. (See Fig. 11. (shown above): Correct position in viewing the charts, the eyes directly perpendicular to the surface of the charts, the light as nearly as possible from the side.)
III. The Mask.
The most satisfactory results will be obtained by using masks or templates made from gray cardboard. Three masks (A, B, and C) may be prepared by cutting holes, as indicated, through the three sheets of Strathmore Munsell gray cardboard which will be found at the back of this book. These holes are designed to expose equal areas of sample and standard at the same time. Two alternative methods of working with masks are provided.
In on case mask B is used to cover the sample so that an area equal in size to the color rectangles is visible through the hole. Mask A is placed successively over the rectangles most nearly matching the sample and these are compared with the sample, viewed through mask B, as described below. In the second case the sample is placed behind mask C so that it occupies one-half of the double sized hole. The mask is then moved over the color chart so that the other half of the hole is occupied successively by the rectangles most nearly matching the sample. In this second method the sample and the standard are directly adjacent to each other.
IV. Preliminary Color Measurement.
The two special HUE charts act as key charts in this connection. They illustrate the twenty HUES, showing the maximum CHROMAS which are obtained on every level of VALUE. By moving mask A over the chart and comparing with the sample behind mask B, it is possible to find approximately the position which this sample would occupy on the chart, and thus to obtain a rough idea of its HUE, VALUE, and CHROMA.
V. Measurement of HUE.
Turn to the Constant CHROMA chart which corresponds most closely to the estimated CHROMA of the sample and find the portion of this chart corresponding to the estimated HUE an VALUE of the sample. Move mask A from left to right on the nearest VALUE level until the closest HUE match is obtained to the sample viewed through mask B. If the HUE of the sample does not exactly match any of the twenty HUES shown on the chart, the numerical notation of HUE, which was explained in a previous chapter, may be used to express the estimated distance of the sample from the nearest adjacent HUES.
VI. Measurement of VALUE.
Move mask A up and down on the Constant CHROMA chart on the nearest line of HUES until the VALUE of the sample behind mask B is definitely located. If a very accurate determination of VALUE is desired, alternate the aperture in the mask between the two squares which most nearly match the sample in VALUE, and determine where the sample falls between these two standards. The exact position of the sample may then be expressed in tenths of a VALUE step.
VII. Measurement of CHROMA.
Turn to the one of the six circular Contact VALUE charts which corresponds most closely to the estimated VALUE of the sample. Disregarding any slight HUE and VALUE difference, move mask A back and forth in a radial (in and out) direction on the spoke, or radius, which corresponds most closely to the estimated HUE of the sample, always comparing the successive rectangles with the sample behind mask B. In this manner a reliable estimation of CHROMA may be obtained. For instance, the hypothetical sample may appear very close to 6 in CHROMA. In most instances it is sufficient to express the CHROMA of a sample in full CHROMA steps. If so desired, half steps of CHROMA may be estimated, but the accuracy of this method of comparison does not warrant the estimation of less than half steps of CHROMA.
Note:– If the CHROMA of the sample is stronger than is shown on the chart for that particular HUE, its CHROMA may be estimated as follows: impress on the mind the last few CHROMA steps shown on the chart and immediately judge the distance from the last step on the chart to the more vivid color sample. With a little practice, remarkable consistent results can be obtained. For instance, if CHROMAS of 6, 8, and 10 are shown on the chart and the hypothetical sample is estimated to be a distance beyond 10 equivalent to the distance from 6 to 10, then the CHROMA of the sample would be 14.
VII. Specialized Measurement.
A short cut in the measurement of VALUE and CHROMA may be taken if the HUE of the sample corresponds exactly or very nearly to one of the ten HUES shown in the form of Constant HUE charts. Reference to the Constant HUE chart corresponding to the HUE in question will serve to place very quickly the VALUE and CHROMA of the sample. It is advisable to make use of masks A and B in this case also.
Check out the other sections of the Munsell Book of Color:
The Munsell Book of Color: Foreward by F.G. Cooper
The Munsell Book of Color 1929: Preface by A.E.O. Munsell
The Munsell Book of Color 1929: Hue, Value, and Chroma
The Munsell Book of Color 1929: The Color Sphere
The Munsell Book of Color 1929: The Charts

Leave a Reply