
In this blog, we discuss how to create a color wheel using the Munsell color order system and how to apply concepts of the resulting color harmony to developing visual analytics.
Color harmony is the process of choosing colors that work well together in the composition of an image. Similar to concepts in music, there are “color chords” on a color wheel that help to provide common guidelines for how hues will work together. These color chords are generalized recommendations with the final color selection dependent on specific parameters associated with the given design project. In this short discussion, we work through two color harmony types: complementary and analogous. We then apply these color harmonies to visual analytics. The examples shown here are basic infographics or charts that can be generated with software tools like Microsoft Excel or Word, Apple Numbers or Pages, Google Docs, Tableau Software, and many others. For our examples, we used the chart functions in Apple Numbers and Apple Pages.
Building the Munsell Color Wheel
The Munsell color order system defines hue attributes as actual colors and establishes five principal hues. These principal hues are Red (R), Yellow (Y), Green (G), Blue (B) and Purple (P) and are equally spaced in clockwise order around a color circle or wheel. These principal hues are separated by five intermediate or mixture colors. The intermediate hues are defined as Yellow Red (YR), Green Yellow (GY), Blue Green (BG), Purple Blue (PB), and Red Purple (RP). The color wheel is measured off in one hundred compass points resulting in 100 steps on the hue circle. Each of the primary and intermediate colors are allocated a range of ten degrees on the color circle and are located at the mid-point of this segment. In Munsell notation, primary Yellow is identified as 5Y and is at the midpoint of its segment. 2.5Y indicates yellow progressing toward Yellow Red with 7.5Y transitioning toward Green Yellow. 10Y is the end point of the Yellow segment, positioned equally between the primary Yellow (5Y) and intermediate Green Yellow (5GY). This notation concept results in forty standard hue circle divisions. In Munsell notation, Orange is defined as Yellow Red. We depict the Munsell hue circle or color wheel below in Figure #1.
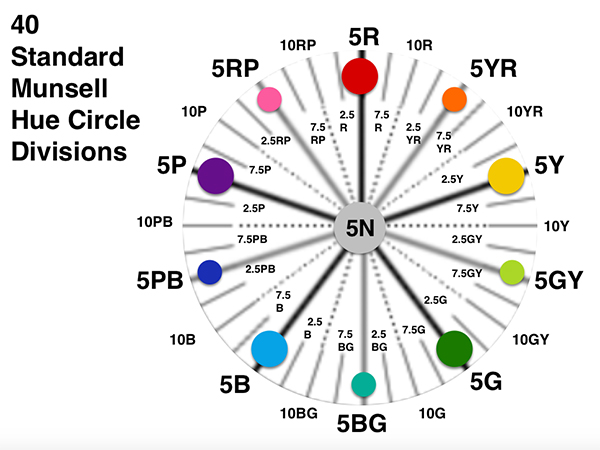
Figure #1: The Munsell hue wheel divided into forty circle divisions.
Two Color Harmony Types with Visual Analytics Examples
The Munsell color notation system is designed so that each color has a logical relationship to all other colors. This is depicted on the color wheel in Figure #1. As we noted previously, this concept is called color harmony. Two colors on opposite sides of the hue wheel are called a complementary color harmony. Three colors adjacent to each other are defined as analogous color harmony. We will describe each of these color harmonies with visual analytics examples below.
What is Complementary Color Harmony?
Two colors on opposite sides of the hue wheel are called complementary colors. For 5G (Green), the complementary color in Munsell notation would be 5RP (Red Purple). Combining 5G with 5RP results in the 5N neutral Gray color at the center of the Munsell hue wheel shown in Figure #1. We apply the 5G and 5RP complementary harmony to a visual analytics example of a three-dimensional stacked area chart in Figure #2.

Figure #2: The Munsell Complementary color harmony of 5G and 5RP applied to a three-dimensional stacked area chart.
What is Analogous Color Harmony?
Three colors that are next to each other on the color wheel define an analogous harmony. We can combine 5B (Blue), 5BG (Blue Green), and 5G (Green) to produce an adjacent color scheme on the Munsell color wheel. We apply this result to a three dimensional bar chart in Figure #3 below.
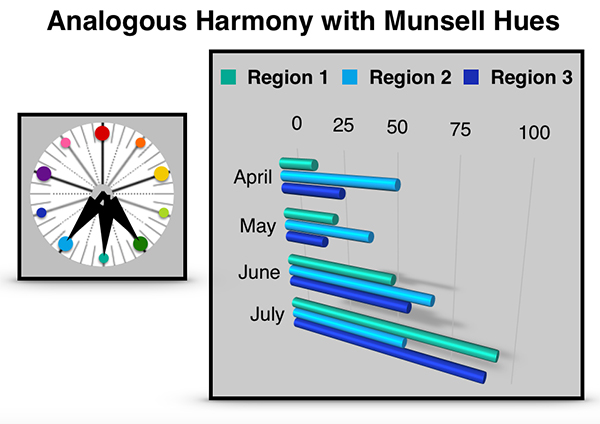
Figure #3: The Munsell Analogous color harmony of 5B, 5BG and 5G applied to a three-dimensional bar chart
Summary
In this short discussion, we have shown how to build a color wheel from the Munsell color order system. We then demonstrated how each color on the wheel has a logical relationship to all other colors to create color harmony. We highlighted the complementary and analogous color harmonies and demonstrated a visual analytics example for each case. There are many other color harmonies that can be explored and applied to color selection. If you would like to explore this topic further, please examine Chapter 4: Defining Color Harmony of my book on, “Applying Color Theory to Digital Media and Visualization” from CRC Press.
About the Author
 Theresa-Marie Rhyne is an expert in the field of computer-generated visualization and a consultant who specializes in applying artistic color theories to visualization and digital media. She has consulted with the Stanford University Visualization Group on a color suggestion prototype system, the Center for Visualization at the University of California at Davis and the Scientific Computing and Imaging Institute at the University of Utah on applying color theory to ensemble data visualization. Follow the link for more information on her book: “Applying Color Theory to Digital Media and Visualization” is available from CRC Press.

Leave a Reply