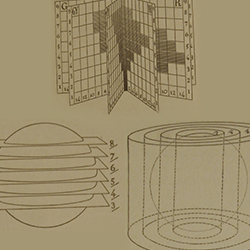
This section of the 1st edition of the Munsell Book of Color from 1929 discusses the colors of constant hue (diagram of 10 vertical charts), value (diagram 6 radial charts) and chroma (diagram of 8 cylindrical charts).
Colors of Constant Hue
Ten Vertical Charts
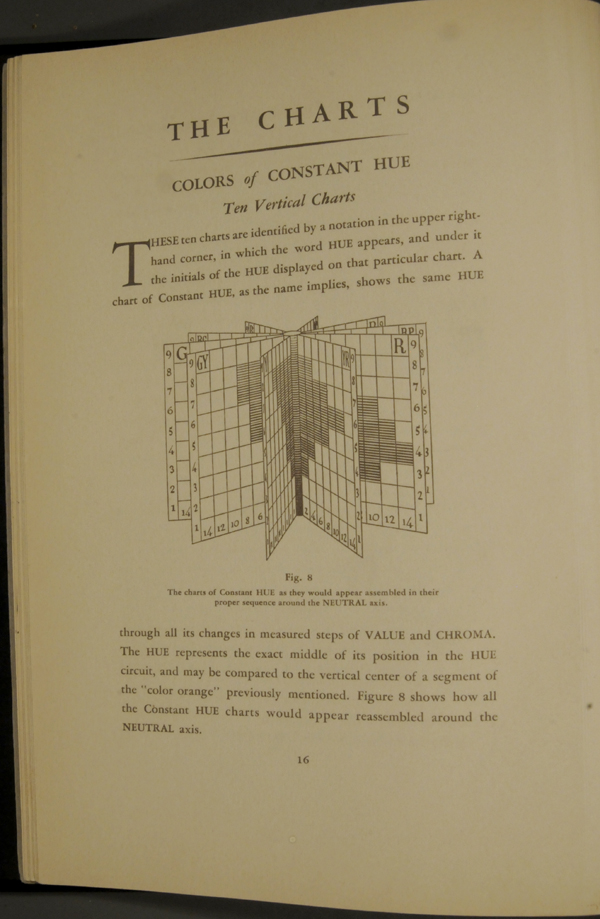
These ten charts are identified by a notation in the upper right-hand corner, in which the word HUE appears, and under it the initials of the HUE displayed on that particular chart. A chart of Constant HUE, as the name implies shows the same HUE through all its changes in measured steps of VALUE and CHROMA. The HUE represents the exact middle of its position in the HUE circuit, and may be compared to the vertical center of a segment of the “color orange” previously mentioned. Figure 8 shows how all the Constant HUE charts would appear reassembled around the NEUTRAL axis.
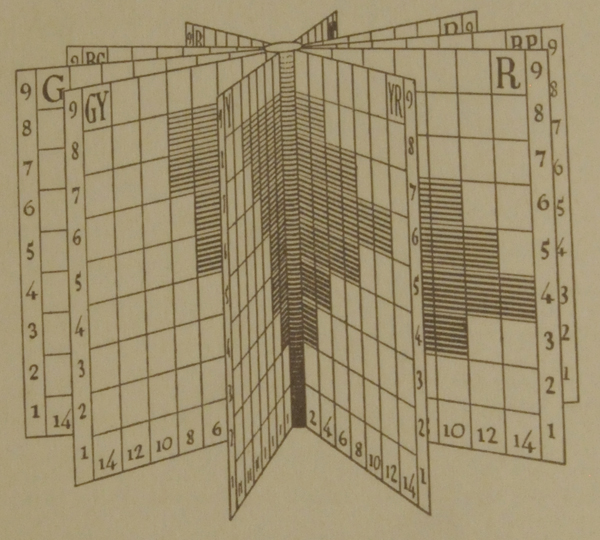
Fig. 8 The charts of Constant HUE as they would appear assembled in their proper sequence around the NEUTRAL axis.
Colors of Constant Value
Six Radial Charts
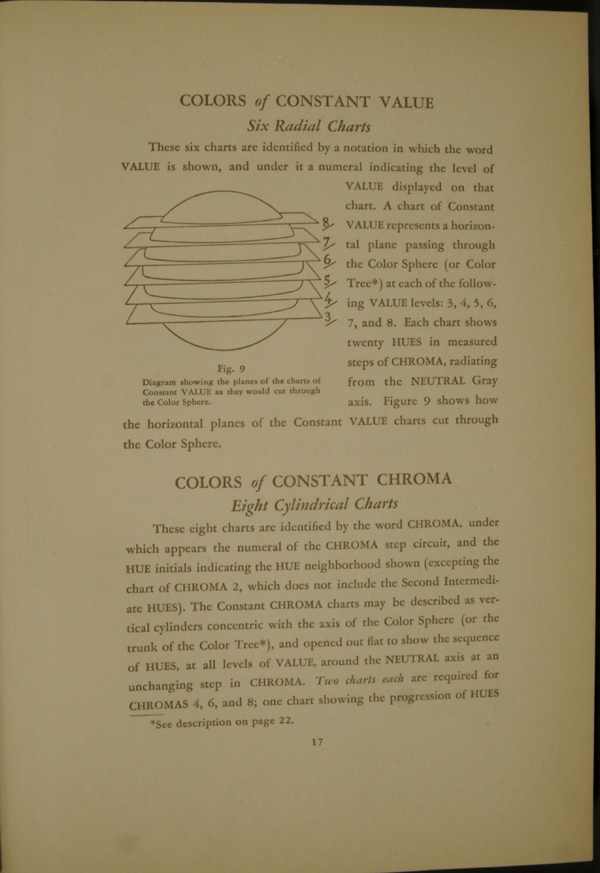
These six charts are identified by a notation in which the word VALUE is shown, and under it a numeral indicating the level of VALUE displayed on that chart. A chart of Constant VALUE represents a horizontal plane passing through the Color Sphere (or Color Tree*) at each of the following VALUE levels: 3, 4, 5, 6, 7, and 8. Each chart shows twenty HUES in measured steps of CHROMA, radiating from the NEUTRAL Gray axis. Figure 9 shows how the horizontal planes of the Constant VALUE charts cut through the Color Sphere.
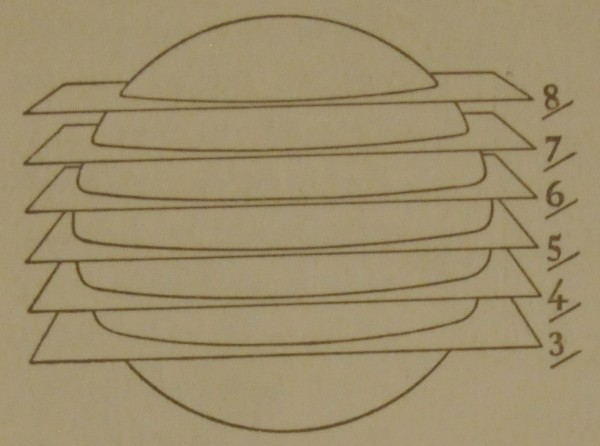
Fig. 9 Diagram showing the planes of the charts of Constant VALUE as they would cut through the Color Sphere.
Colors of Constant CHROMA
Eight Cylindrical Charts
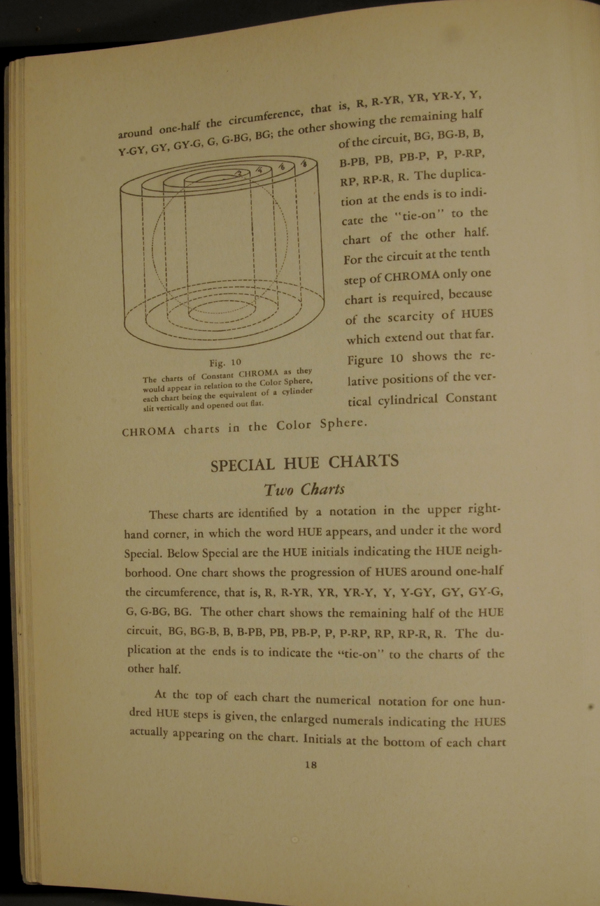
These eight charts are identified by the word CHROMA, under which appears the numeral of the CHROMA step circuit, and the HUE initials indicating the HUE neighborhood shown (excepting the chart of CHROMA 2, which does not include the Second Intermediate HUES). The Constant CHROMA charts may be described as vertical cylinders concentric with the axis of the Color Sphere (or the trunk of the Color Tree*), and opened out flat to show the sequence of HUES, at all levels of VALUE, around the NEUTRAL axis at an unchanging step in CHROMA. Two charts each are required for CHROMAS 4, 6, and 8; one chart showing the progression of HUES around one-half the circumference, that is, R, R-YR, YR, YR-Y, Y, Y-GY, GY, GY-G, G-BG; the other showing the remaining half of the circuit, BG, BG-B, B, B-PB, PB, PB-P, P, P-RP, RP, RP-R, R. The duplication at the ends is to indicate the “tie-on” to the chart of the other half. For the circuit at the tenth step of CHROMA only one chart is required, because of the scarcity of HUES which extend out that far. Figure 10 shows the relative positions of the vertical cylindrical Constant CHROMA charts in the Color Sphere.
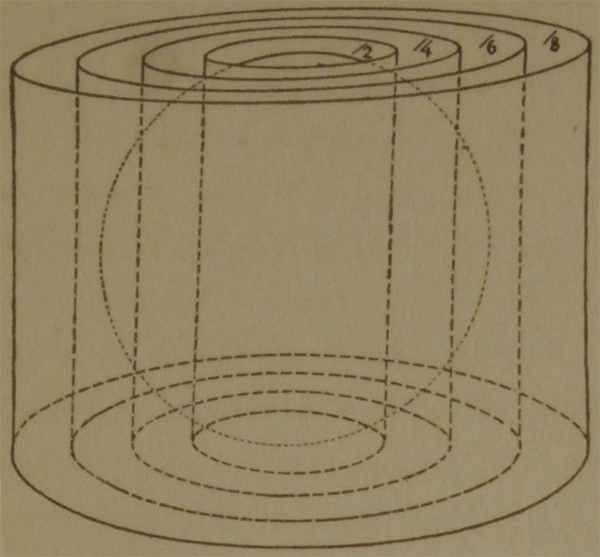
Fig. 10 The charts of Constant CHROMA as they would appear in relation to the Color Sphere, each chart being the equivalent of a cylinder slit vertically and opened out flat.
Special Hue Charts
Two Charts
These charts are identified by a notation in the upper right-hand corner, in which the word HUE appears, and under it the word Special. Below Special are the HUE initials indicating the HUE neighborhood. One chart shows the progression of HUES around one-half the circumference, that is, R, R–YR, YR, YR-Y, Y, Y-GY, GY, GY-G, G, G-BG, BG. The other chart shows the remaining half of the HUE circuit, BG, BG-B, B-B-PB, PB-P, P, P-RP, RP, RP-R, R. The duplication at the ends is to indicate the “tie-on” to the charts of the other half.
At the top of each chart the numerical notation for one hundred HUE steps is given, the enlarged numerals indicating the HUES actually appearing on the chart. Initials at the bottom of each chart trace the sequence of HUES; numerals at the side trace the sequence of VALUES; and the small numeral below each color rectangle is an index of its CHROMA. Each HUE is illustrated in the maximum of CHROMA which it attains at each level of VALUE.
*See description on page 22.
The Munsell Book of Color: Foreward by F.G. Cooper
The Munsell Book of Color 1929: Preface by A.E.O. Munsell
The Munsell Book of Color 1929: Hue, Value, and Chroma
The Munsell Book of Color 1929: The Color Sphere


Yes!!!!! Finally! Someone who loves color and the science of color
Madam,
Sir,
thank you for this page but could you also list the color charts of Volume 2 of The Munsell Book of Color 1929 Standard edition. Unless I skipped it, nothing is mentionned in Volume 1 about those 30 additionnal charts in Volume 2 in which there is no text (at least not in my copy, there isn’t even a front page, should there be ?). Thank you already for this information. Best regards. Felix A. D’Haeseleer