Typically, a triad color harmony uses three colors that are equally spaced around a color wheel where the total numbers of hues can be divided into three. For Munsell Color Harmony, this is not possible since there are a total number of ten hues spaced around the wheel.
As we discussed in our earlier blog entry on, “Visual Analytics with Complementary and Analogous Color Harmony,” the Munsell color order system defines hue attributes as actual colors and establishes five principal hues. These principal hues are Red (R), Yellow Y), Green (G), Blue (B) and Purple (P) and are equally spaced in clockwise order around a color circle or wheel. These principal hues are separated by five intermediate or mixture colors. The intermediate hues are defined as Yellow Red (YR), Green Yellow GY), Blue Green (BG), Purple Blue (PB), and Red Purple (RP). The color wheel is measured off in one hundred compass points resulting in 100 steps on the hue circle. Each of the primary and intermediate colors are allocated a range of ten degrees on the color circle and are located at the mid-point of this segment. This presents a challenge in defining a triad color harmony since 10 does not equally divided into three. Below, we show two possible approaches to creating a triad color harmony with the Munsell Color Wheel.
The Isosceles Triad Scheme
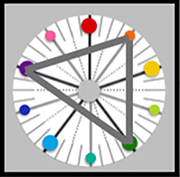
In geometry, an isosceles triangle has two sides of equal length. If we apply this concept to the Munsell Color Wheel, stepping four hue spaces from a given hue will yield two hues separated by one space. This forms an isosceles triad color scheme. Below, we depict an example using the Red (5R), Blue (5B) and Green (5G) Munsell hues. We apply this isosceles triad scheme to a visual analytics display of three dimensional stacked bar charts in Figure #1 below.

Figure #1: An Isosceles Triad Color Scheme of Red (5R), Blue (5B) and Green (5G) Munsell hues applied to a three dimensional stacked bar chart example.
The Equilateral Triad Scheme
Returning to geometry concepts again, a triangle that has all sides of the same length is defined as an equilateral triangle. Applying the concept to the Munsell Color Wheel, an equilateral triad color scheme can be created by stepping three hue spaces from a given color. Below, we depict an example using Yellow Red (5YR) and the hues that are three steps away, Purple (5P) and Green (5G). We apply this equilateral triad scheme to a visual analytics example of cylindrical three dimensional bar charts in Figure #2.

Figure #2: An Equilateral Triad Color Scheme of Yellow Red (5YR), Purple (5P) and Green (5G) Munsell hues applied to a three dimensional cylindrical bar chart example.
Summary
In this short discussion, we have shown how to apply fundamental Euclidean geometry principles that define triangles to building Triad Munsell Color Harmonies. Two examples of an Isosceles Triad Color Scheme and an Equilateral Triad Color Scheme are shown. If you would like to explore color harmony concepts further, please examine Chapter 4: Defining Color Harmony of my book on “Applying Color Theory to Digital Media and Visualization” from CRC Press.
About the Author
 Theresa-Marie Rhyne is an expert in the field of computer-generated visualization and a consultant who specializes in applying artistic color theories to visualization and digital media. She has consulted with the Stanford University Visualization Group on a color suggestion prototype system, the Center for Visualization at the University of California at Davis, and the Scientific Computing and Imaging Institute at the University of Utah on applying color theory to ensemble data visualization. Follow the link for more information on her book: “Applying Color Theory to Digital Media and Visualization” is available from CRC Press.

Leave a Reply