In our previous blog entry on “Visual Analytics with Complementary and Analogous Color Harmony,” we discussed how to build the Munsell Color Wheel and presented Complementary and Analogous color harmony examples. In today’s blog entry, we highlight monochromatic and diad color harmony.
What is Monochromatic Color Harmony?
Monochromatic harmony uses one hue, and various tints, tones, and shades associated with that hue.
- A tint is defined as a hue mixed with White.
- A tone is a hue mixed with Gray.
- A shade is a hue mixed with Black.
For Munsell color harmony, it is a rather straight forward process to create a monochromatic color harmony. First, we select a hue. For our example, we will select the 2.5 PB (Purple Blue) hue. Next, we select various tints, tones and shades in the 2.5 PB range. For our visual analytics example, we will apply the 2.5 PB hue including tints, tones, and shades to a pie chart. Figure #1 shows our results.
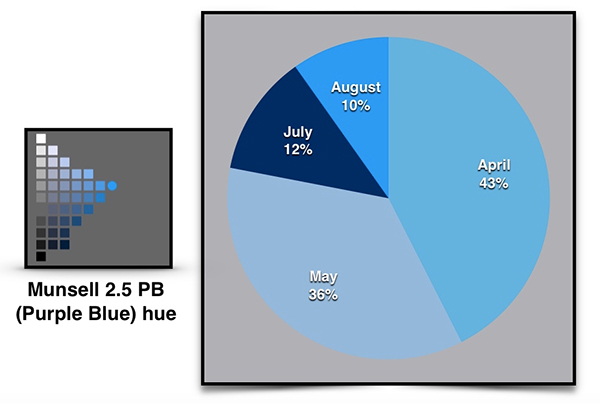
Figure #1: The Munsell Monochromatic color harmony of 2.5 PB applied to a pie chart.
What is Diad Color Harmony?
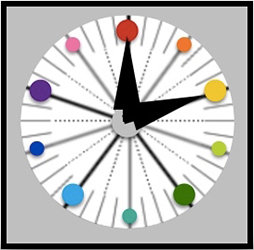
Diad color harmony uses two colors that are two colors apart on the color wheel. Returning to the Munsell Color Wheel that we created in our previous blog entry, we can select 5R (Red) and 5Y (Yellow) as a diad color harmony. Figure #2 shows the application of our 5R and 5Y diad color harmony to a bubble chart plot. This visual analytics example, and our previous pie chart, can be generated with tools like Microsoft Excel or Word, Apple Numbers, or Pages, Google Docs, Tableau Software, and many others.
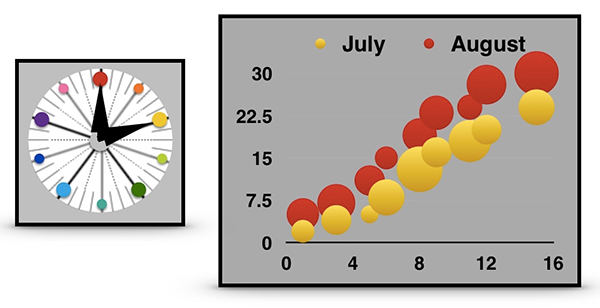
Figure #2: The Munsell Diad color harmony of 5R and 5Y applied to a bubble chart.
Summary
In this short discussion, we have demonstrated how two fundamental color harmonies, Monochormatic and Diad, can be applied to the Munsell color order system to aid in creating visual analytics or other digital media examples. If you would like to explore this topic further, please examine Chapter 4: Defining Color Harmony of my book, “Applying Color Theory to Digital Media and Visualization,” from CRC Press.
About the Author

Theresa-Marie Rhyne is an expert in the field of computer-generated visualization and a consultant who specializes in applying artistic color theories to visualization and digital media. She has consulted with the Stanford University Visualization Group on a color suggestion prototype system, the Center for Visualization at the University of California at Davis, and the Scientific Computing and Imaging Institute at the University of Utah on applying color theory to ensemble data visualization. Follow the link for more information on her book: “Applying Color Theory to Digital Media and Visualization” is available from CRC Press.

Leave a Reply