
In our earlier blog entry on “Visual Analytics with Complementary and Analogous Color Harmony,” we discussed how to build the Munsell Color Wheel, and presented Complementary and Analogous color harmony examples. In today’s blog entry, we highlight two advanced color harmony examples: Double Complementary and Split Complementary.
Applying Double Complementary Harmony
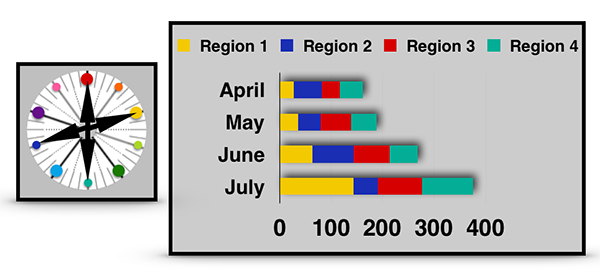
As noted in our earlier blog entry, two colors on opposite sides of the hue wheel are called complementary colors. We can create a more complex harmony by working with a second set of complementary colors. These four colors combined form a Double Complementary Color Harmony. Returning to the Munsell Color Wheel we created previously, we can select 5Y (Yellow) and 5PB (Purple-Blue) as our first complementary pair. Next, we move two steps to the right on the Munsell Color Wheel to select 5BG (Blue-Green) and the opposing 5R (Red) as our second complementary pair. Figure 1 (below) shows the application of 5Y, 5PB, 5R, and 5BG to a horizontal bar chart with four variables.
Applying Split Complementary Color Harmony
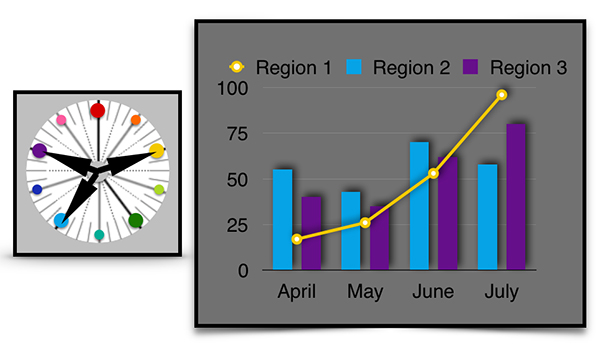
A split complementary harmony combines a key color with the two colors on either side of its complementary color. For the Munsell Color Wheel, 5Y (Yellow) is complementary to 5PB (Purple-Blue). So, the split complementary hues as 5B (Blue) and 5P (Purple). Figure 2 (below) shows a two variable bar chart with a line plot example. The line plot is depicted in the key 5Y hue with the two bar chart variable depicted in the 5B and 5P split complementary hues. This visual analytics example and our previous horizontal bar chart can be generated with tools like Microsoft Excel or Word, Apple Numbers, or Pages, Google Docs, Tableau Software and many others.
Summary
In this short discussion, we have shown how to apply two advanced color harmonies, Double Complementary and Split Complementary, to the Munsell color order system for assisting in creating visual analytics or other digital media examples. If you would like to explore this topic further, please examine Chapter 4: Defining Color Harmony of my book on “Applying Color Theory to Digital Media and Visualization,” from CRC Press.
About the Author
 Theresa-Marie Rhyne is an expert in the field of computer-generated visualization and a consultant who specializes in applying artistic color theories to visualization and digital media. She has consulted with the Stanford University Visualization Group on a color suggestion prototype system, the Center for Visualization at the University of California at Davis, and the Scientific Computing and Imaging Institute at the University of Utah on applying color theory to ensemble data visualization. Follow the link for more information on her book: “Applying Color Theory to Digital Media and Visualization” is available from CRC Press.

Leave a Reply