
Theresa-Marie Rhyne is a visualization consultant, specializing in applying color theory to digital media and visualization. From 2010 through 2012, she consulted for the Scientific Computing and Imaging Institute at the University of Utah. She is currently consulting for the University of California at Davis Center for Visualization and the Stanford University Visualization Group.
You can discover more of her journeys in the fields of visualization and digital media on her blog.
In additional to assisting in color selection, the two dimensional cross sections of Munsell colors can also influence data visualization design and layout. We show this in a visualization method that facilitates the exploration and identification of patterns in the correlation of biological data.
Visualizing the Patterns of Protein Binding Using Munsell
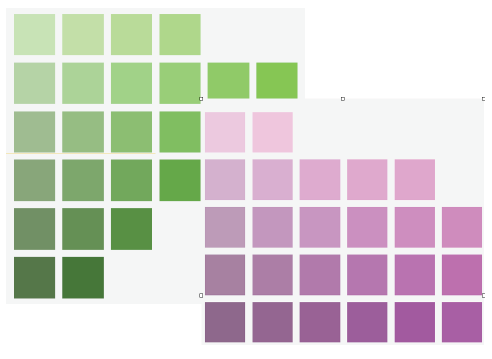
Below, we show the merger of Munsell 10 GY and the Munsell 10 P cross sections.
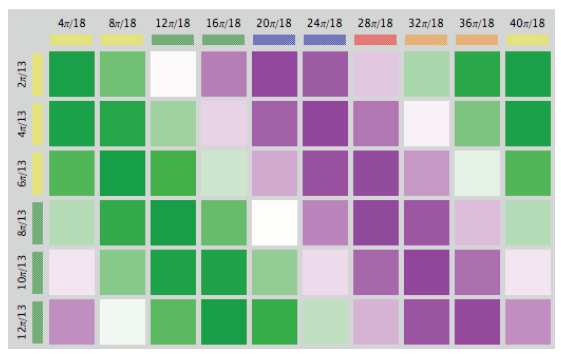
Next, we apply this visual concept to a global view of temporal relationships between biological variables. We show these results below.
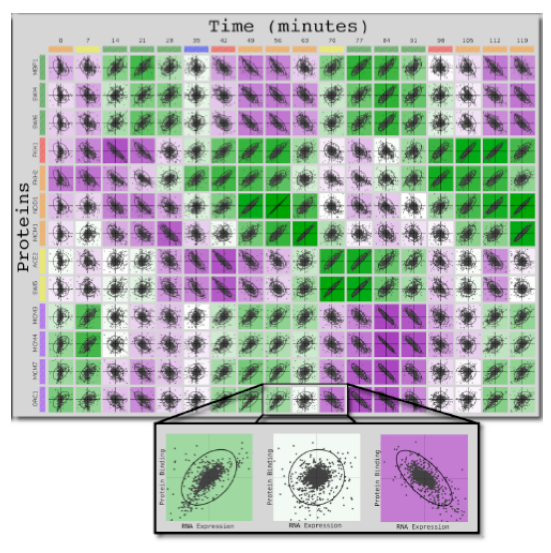
 Next, we finalize our large-scale molecular biological visualization by including local views of the underlying data.
About the Biological Data Visualization Project
 These visualization efforts were part of research efforts conducted at the Scientific Computing and Imaging Institute (SCI) at the University of Utah in 2011. During that time frame, I served as a color theory consultant on this biological visualization project. Our work was published as a poster at the first IEEE Symposium on Biological Data Visualization, October 23rd – 24th, 2011 in Providence, Rhode Island. Here is the official citation and URL to the poster abstract: “Visualizing Global Correlation in Large-Scale Molecular Biological Data” by A.N.M. Choudhury, Kristin Potter, Theresa-Marie Rhyne, Yarden Livnat, Chris Johnson and Orly Alter, (http://www.biovis.net/2011/papers_abstracts/abstracts/120.html).
You can learn more about using Munsell Color to apply artistic color theories to visualization here.

Great share!!
Thank you for the opportunity to prepare this Blog entry.
I now have a forthcoming book on Applying Color Theory to Digital Media and Visualization from CRC press. In the book, I cover Munsell Color in Chapter 3 and this particular case study in Chapter 6.
See: https://www.crcpress.com/Applying-Color-Theory-to-Digital-Media-and-Visualization/Rhyne/p/book/9781498765497
Writing this Blog entry helped my crystalized many concepts that eventually evolved into content presented in my book.
Thank you.