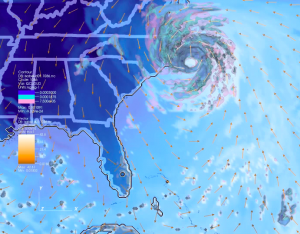
In our blog entry on “Visual Analytics with Complementary and Analogous Color Harmony”, we discussed how to build the Munsell Color Wheel and presented Complementary and Analogous color harmony examples. In today’s blog entry, we highlight how to combine these concepts to build a complex color harmony for a scientific data visualization of a computationally modeled hurricane.
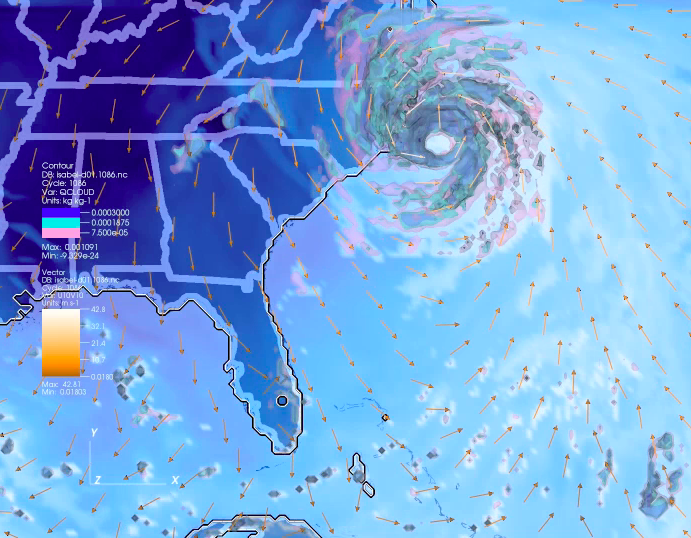
Applying Analogous Color Harmony to Depict the Ocean:
For our First step, we want to develop an Analogous Color Harmony in the Key of 5PB (Purple Blue) to depict the ocean where the hurricane will start. Additionally, we want to include a map of the Eastern United States we will use as a reference for the location of the hurricane as it builds and progresses over time. An analogous harmony combines a key color (5PB) with the two colors on either side of it on the Munsell Color Wheel, 5B (Blue) and 5P (Purple). We show these results in Figure 1 below with a small snapshot of our intended visualization. The wind vectors are included for reference for the hurricane build up.
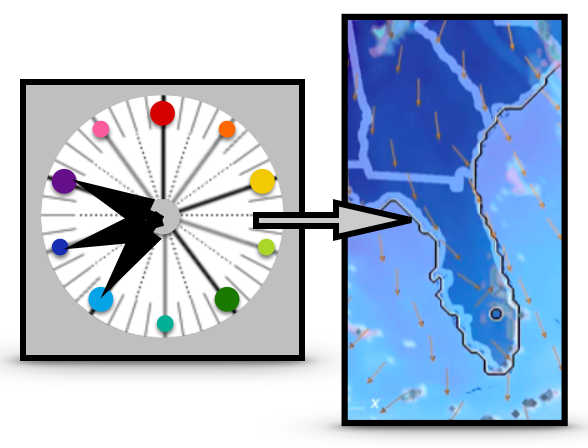
Figure#1: Analogous Color Harmony in the Key of 5PB (Purple Blue) to depict the ocean where the computationally modeled hurricane begins and the surrounding land mass. The analogous harmony combines 5PB and its adjacent colors of 5B and 5P on the Munsell Color Wheel.
Building a Extended Analolgous Color Harmony to Depict the Hurricane:
For our second step, we depict the hurricane as it builds up. We want to show the center of the hurricane and the surrounding less intense elements. To do this, we select two colors on either side of the Analogous Color Harmony in the Key of 5PB. These two colors are 5RP (Red Purple) and 5BG (Blue Green). We use 5BG (Blue Green) to depict the large mass of the hurricane and 5RP (Red Purple) to depict the surrounding less intense cyclone elements. We show these results in Figure 2 below with a small snapshot of the hurricane in our intended visualization. A blue gray color surrounds the eye of the hurricane as the 5RP and 5BG and 5PB colors mix together digitally.
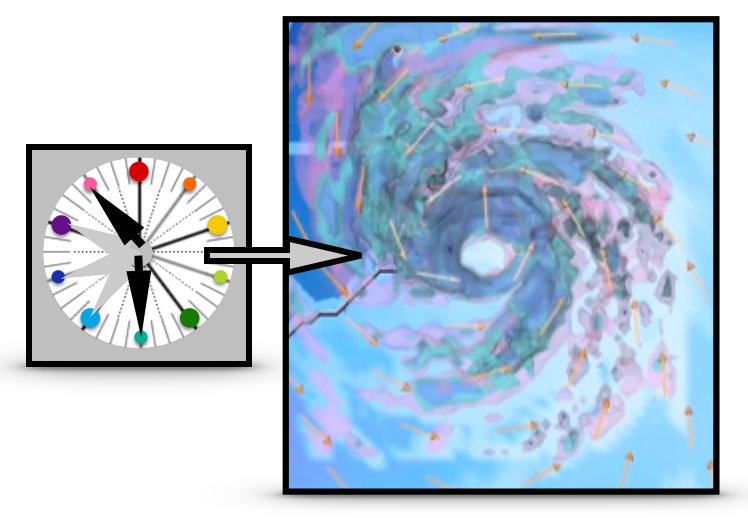
Figure#2: Extending the Analogous Color Harmony in the Key of 5PB (Purple Blue) to include the two colors 5RP (Red Purple) and 5BG (Blue Green) that sit on either side of the 5B, 5PB and 5P family on the Munsell Color Wheel. The center of the hurricane is depicteded in the 5BG color and the surrounding less intense elements are shown in the 5RP color.
Using a Complementary Color Harmony to Depict the Wind Vectors:
Our third and Final step is to use a complementary color harmony to emphasize the wind vectors against the ocean. Two colors that are directly opposite each other on the hue wheel are called complementary colors. For 5B (Blue), the complementary color is 5YR (Yellow Red or Orange). We apply the concept to have a contrasting set of 5YR (Orange) wind vectors against the 5B, 5PB, and 5P analogous color elements in the ocean. We show these results in Figure 3 below with a small snapshot of the wind vectors in the ocean.
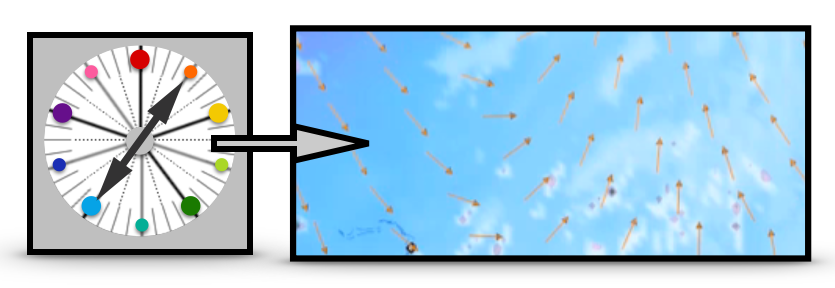
Figure#3: The color of the wind vectors in our visualization of the computationally modeled hurricane is selected as 5YR (Yellow Red or Orange). The 5YR color is directly across from the 5B (Blue) color on the Munsell Color Wheel and forms a resullting complementary color harmony. In Munsell Color Space, Orange is defined as Yellow Red.
Combine Color Harmonies to Complete the Hurricane Scientific Visualization:
Figure 4 depicts how the analogous, extended analogous, and complementary color harmonies
combined to complete our scientific data visualization of a computational modeled hurricane. Figure 4 is only one frame from the animation used to depict the build up of the hurricane over time.
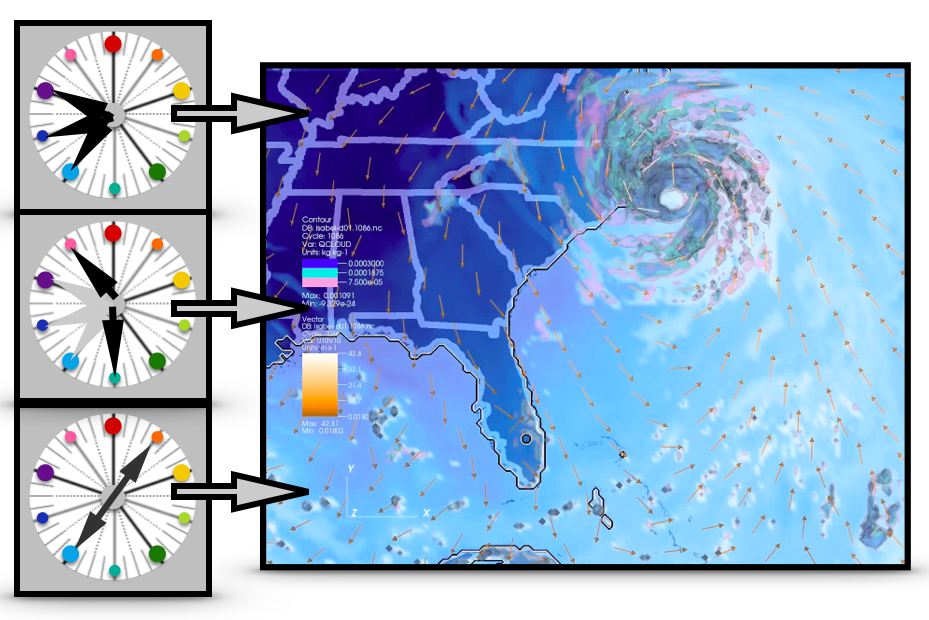
Figure#4: The Analogous, Extended Analogous and Complementary Harmonies on the Munsell Color Wheel for our Computationally Modeled Hurricane are summarized.
Summary:
In this short discussion, we have shown how to combine Analogous, Extended Analogous and
Complementary color harmonies for depicting a scientific data visualization of a computationally
modeled hurricane. If you would like to explore this topic further, please examine Chapter 4: Defining Color Harmony of my book on “Applying Color Theory to Digital Media and Visualization” from CRC Press.
About the Author:
Theresa-Marie Rhyne is an expert in the field of computer-generated visualization and a consultant who specializes in applying artistic color theories to visualization and digital media. She has consulted with the Stanford University Visualization Group on a color suggestion prototype system, the Center for Visualization at the University of California at Davis and the Scientific Computing and Imaging Institute at the University of Utah on applying color theory to ensemble data visualization. Follow the link for more information on her book: “Applying Color Theory to Digital Media and Visualization” is available from CRC Press.


Leave a Reply